November, 2008
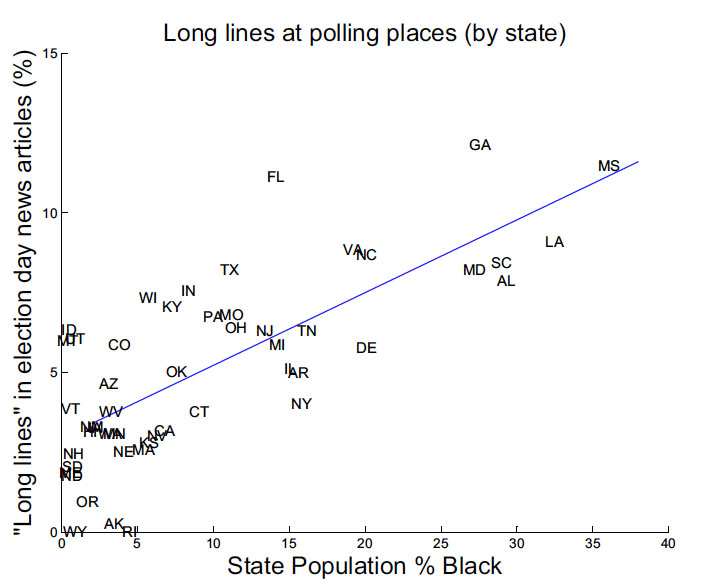
The graph illustrates that long lines are strongly correlated with race. The historical allusion in Rachel Maddow's term "the new poll tax" is well justified. (Graph as a pdf.)
See the Nov. 25 2008 article at In These Times: Are Long Lines the "New Poll Tax"?
Polling place lines reduce the number of people who vote. We've all heard stories of determined voters who get in line & stay in line for hours despite cold, drizzle, hunger and (this election) even the onset of labor. We see them in news footage. We don't see the people who can't afford to wait in a long line, or just decide it isn't worth it.
Disincentives to vote have a long history, most notoriously the poll tax used in various states to reduce African-American turnout between 1870 and 1966.
Long lines work to the advantage of one party more than the other - see #5 below.
Video segments on polling place lines:
The new poll tax (flash video)
Rachel MaddowRepublican advantage of polling place lines (flash video, start at 3:00)
Rachel Maddow & Republican strategist Paul Weyrich
1. Is "percent of news articles" a good measure of the severity of lines?
It's an indirect measure. I used google news to find out how many election-day news stories originating in each state were about voters, and what fraction of those talked about long lines. Of course it would be better to have actually monitored the line length at polling places. That's not as difficult as it sounds, and it's not too late; see below.
Also, the graph is done on a whole-state basis, while the line problem varies a lot within a state. Despite the whole-state blurring and the indirect measure of how big a problem there was in each state, the correlation with race is highly evident. This would generally indicate a much more intense effect going on at the local level.
2. How could this study be done more definitively?
As far as I can tell no one collects line-length information methodically across rural and urban America. However, voters have this information in their heads, and it can be obtained in a statistically valid way even now: pick one or two voters from a random selection of 1000 precincts and call them, and ask how long they waited to vote. Then look up the census data for race (and other factors) for their precinct.
3. Could the evident correlation be due to high African-American turnout in this election?
Despite the predictions, turnout wasn't especially high in 2008. And, if polling place equipment was properly allocated in proportion to registered voters, additional African-American voters wouldn't cause greater lines anyway.
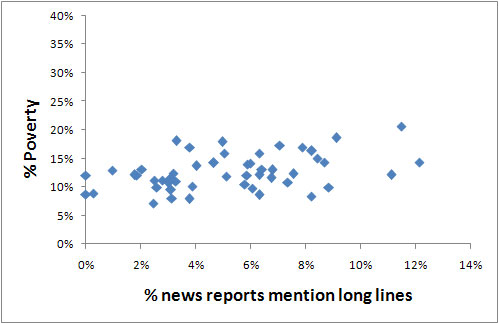
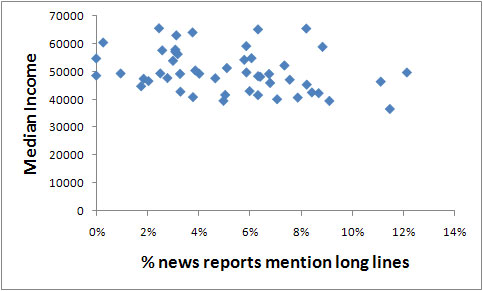
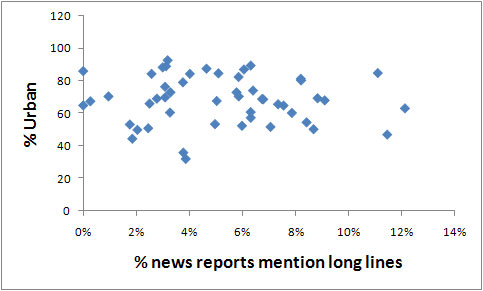
4. I hate to think this is about race. Could the underlying variable be poverty, or income level, or how much of the voting takes place in cities?
Reports of long lines doesn't correlate much to poverty rates or median income or urban fraction.
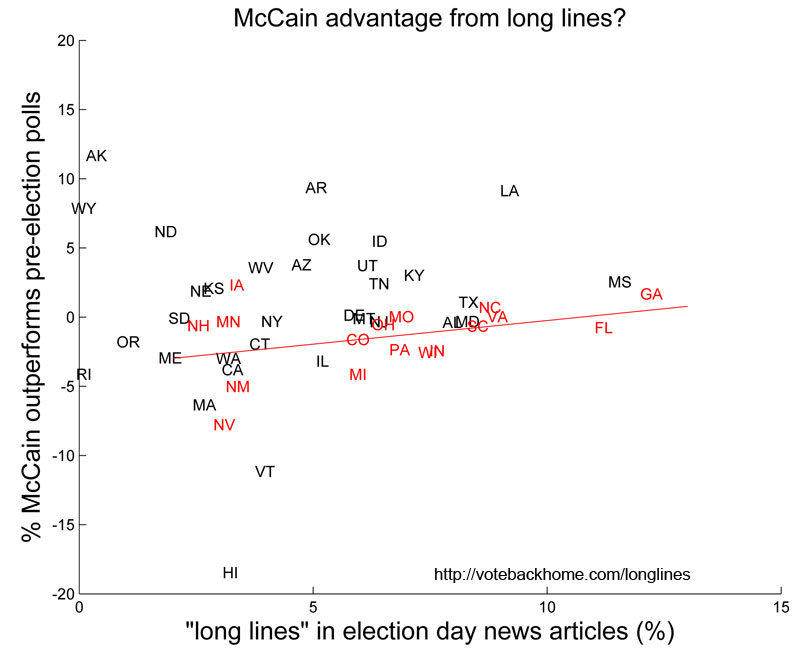
5. Do long lines benefit the Republicans? If so, by how much?
You would think so, if the long lines are more of a problem in minority or urban areas. Paul Weyrich, a Republican strategist excerpted in Rachel Maddow's report (linked above) seems to think so too.
I tried to quantify the Republican advantage, by comparing the pre-election polling of "likely voters" -- people who say they intend to vote -- with the election day results which is of course those who actually did vote. If Republicans get an advantage, McCain should have outperformed his pre-election polls more in states where lines were more severe.
Unfortunately, while the nationwide pre-election polls were very close to the election outcome, polls were not so close at the state level. This leads to a lot of scatter (noise) in the data. Here are the results. The states colored red are the hot 17, which were the states more intensively polled, and the trendline is drawn from those. The most probable size of the Republican advantage, based on this data, is 3% -- a huge amount by election standards. But the reliability of this figure is poor because of the noisy data, and because there could be other causes for poll deviation.
If you can think of a better way to quantify the partisan advantage, let me know.
Michael Peshkin
Northwestern University
peshkin@northwestern.edu
847 491 4630